MACD is an acronym for “Moving Average Convergence and Divergence”. It is a technical analysis method using two exponential moving averages (EMA) developed by Gerald Appel, and it measures the timing of buying and selling by focusing on the direction and divergence.
[membership_protected_content user=non-member] Unlock all premium content by purchasing Monthly Subscription plan. You’ll also get Stock buy/sell levels with charts before market open. Checkout our old stocks levels recommendation. If you already have membership please login [/membership_protected_content]
[membership_protected_content]
MACD usually uses two smooth averages of 12 days and 26 days (different from the simple average), and the difference is called (MACD = 12 days EMA-26 days EMA). In addition, the moving average line of MACD itself (usually used for 9 days) is called “signal”, and it is an analysis method to read how and the level of crossing the two lines of and “signal”.
The exponential smoothing average (EMA) used in this MACD is to calculate the average considering the importance of new data . Specifically, unlike the normal moving average, which simply adds all the values and divides by the number of samples to obtain the average value, only the latest value is doubled in weight.
In other words, for a 12-day EMA, we are embracing the idea that yesterday’s price is more important in predicting today’s price than 12 days ago.
How to measure trading timing using MACD
Normally, when the MACD breaks above the signal, it is considered as a “buy signal”, and when the MACD breaks below the signal, it is considered as a “sell signal” . In order to measure the timing of buying and selling, this MACD and signal golden cross and dead cross are effective. The reason is that the MACD moves faster than the signal, so when the MACD breaks the signal from bottom to top, it is called a “buy signal” and the opposite is called a “sell signal”.
Furthermore, if the MACD is above the zero line, it can be regarded as a full-scale rise, and if the MACD is below the zero line, it can be regarded as a full-scale fall .
There is also a way to check if the trend is up by whether the two lines exceed the zero line after the MACD breaks the signal from bottom to top and issues a buy signal. On the contrary, after the sell signal is given, if these two lines fall below the zero line, it is judged that the downtrend will continue.
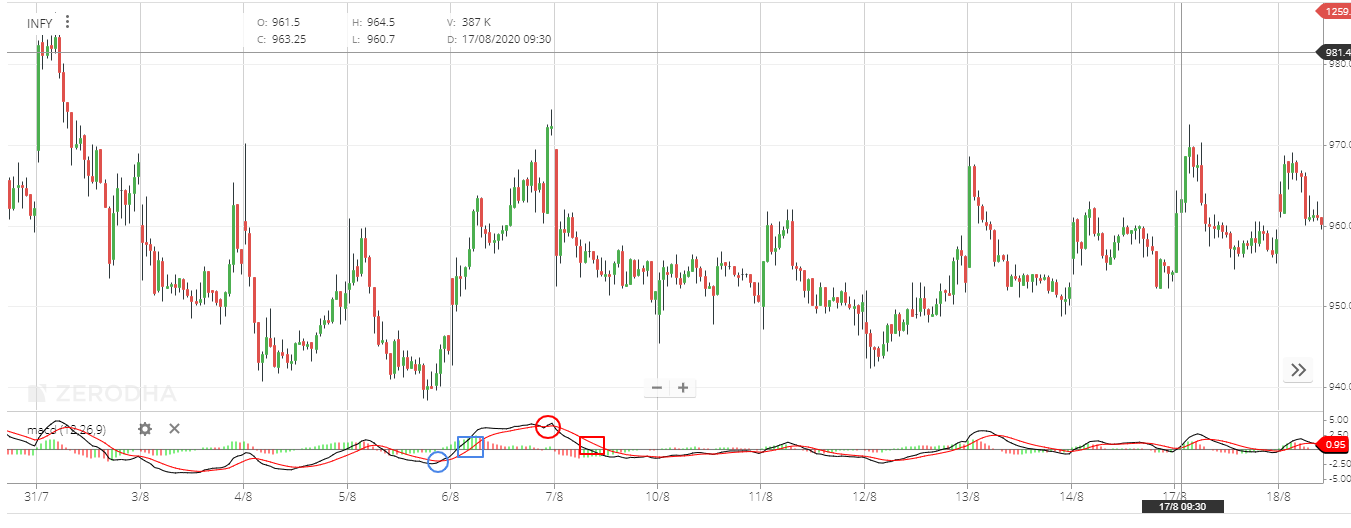
MACD chart example
If you look at the chart below, the red circle can be judged as a “buy signal” when the MACD breaks out of the signal. On the contrary, the red circle part can be judged as a “sell signal” because it is when the breaks below the signal. Also, in the part surrounded by the red square, the exceeded the zero line after the golden cross, and the signal also exceeded the zero line after showing signs of a full-scale rise, so you can see that we have entered the uptrend. .. On the contrary, in the part surrounded by the blue square, the MACD is below the zero line after the dead cross, and the signal is also below the zero line after showing signs of a full-scale decline, so it can be seen that it has entered the downtrend. You can take it.

Normally, when the MACD breaks above the signal, it is considered as a “buy signal”, and when the MACD breaks below the signal, it is considered as a “sell signal”. Furthermore, if the MACD is above the zero line, it can be regarded as a full-scale rise, and if the MACD is below the zero line, it can be regarded as a full-scale fall.
Another option is to check if the MACD is on an uptrend by breaking the signal from bottom to top and issuing a buy signal, and then checking if these two lines are above the zero line. On the contrary, after the sell signal is given, if these two lines fall below the zero line, it is judged that the downtrend will continue.
However, there are many examples of so-called “damage” in conducting such technical analysis, so avoid making judgments by looking at only one index as much as possible, and use it in combination with other indicators to make your own. It is necessary to find the buying and selling timing .
Also, keep in mind that it is very important to create your own investment rules such as loss cuts and follow them in order to make an investment.
[/membership_protected_content]

