
RSI is an acronym for “Relative Strength index” and is translated as “Relative strength index” in Japanese. It was devised by US chart researcher W. Wilder, and is an index that shows “whether the current market price is relatively strong or weak (superheat)”.
[membership_protected_content user=non-member] Unlock all premium content by purchasing Monthly Subscription plan. You’ll also get Stock buy/sell levels with charts before market open. Checkout our old stocks levels recommendation. If you already have membership please login [/membership_protected_content]
[membership_protected_content]
What is RSI?
“RSI” is an index that expresses the ratio of “price increase” to the total price fluctuation range over a certain period (generally 9 days in the short term and 14 days in the medium term). The RSI takes a percentage (%) on the vertical axis and judges overbought and oversold according to the level. We will set up warning areas above and below 50%, and judge that 70% (80% is acceptable) or more is overbought and 30% (20% is acceptable) or less is oversold.
In other words, if the price continues to rise, it will be judged as “overbought” and will be considered for sale, and if it continues to fall, it will be judged as “oversold” and considered for purchase. The initial state of market speed is 9 days. The 9-day RSI has a larger amplitude than the 14-day RSI, so please set it to the one that is easy for you to use.
Difference between
“RSI1” and “RSI2” The calculation method is different between “RSI1” and “RSI2”.
For “RSI1”, the average price increase rate and average price decrease rate for the past ○ days not including the current day are calculated, and finally the numerical value is calculated based on the average value including the price increase and price decrease on the day. “RSI2” is calculated by calculating the total of the price increase and price decrease from the previous day’s closing price of the past ○ days including the current day, and dividing by the number of days.
How to measure trading timing using RSI
As a guideline for buying and selling, it is generally said that when the RSI value is 70% or more, it is in the overbought area, and conversely, when it is 30% or less, it is in the oversold area .
Then, there is a method of “selling” as a sell sign when entering the overbought area of 70% or more, and a method of “selling” when the movement is reversed after entering the overbought area. .. Similarly, the buy sign is a method of “buying” as a buy sign when entering the oversold area of 30% or less, and a “buying” when the movement is reversed after entering the oversold area. There is a method to do it.
In any case, as is often the case with technical analysis methods for measuring overheating, if the market price continues to rise or fall, the market price will go too far in one direction. It may not function as a technical indicator.
For this reason, the RSI is the most powerful analytical method in consolidating and moderately rising or falling markets.
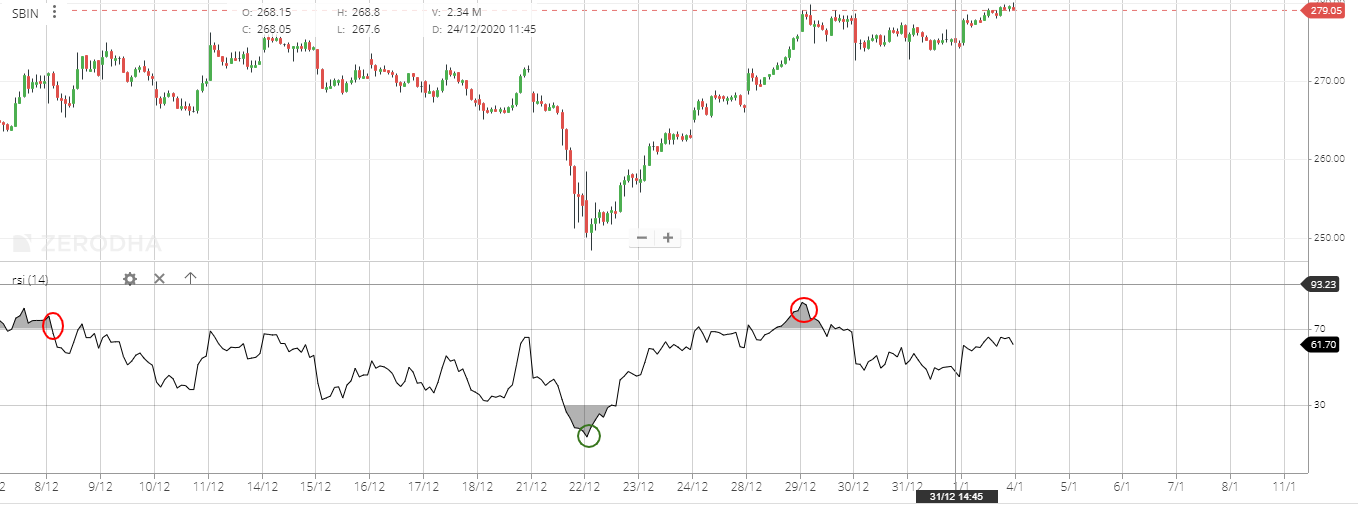
RSI chart example
If you look at the chart below, you can judge that the green circle is the “buy signal” where the RSI value is reversed at 30% or less. On the contrary, the red circle part can be judged as a “sell signal” in which the RSI value is reversed at 70% or more.
It is generally said that when the RSI value is 70% or more, it is in the overbought area, and when it is 30% or less, it is in the oversold area. Then, there is a method of “selling” as a sell sign when entering the overbought area of 70% or more, and a method of “selling” when the movement is reversed after entering the overbought area. ..
Similarly, the buy sign is a method of “buying” as a buy sign when entering the oversold area of 30% or less, and a “buying” when the movement is reversed after entering the oversold area. There is a method.
As you can see from the screen, there are some places where the movement is opposite to the signal. This is called “False signal”, but what you should be aware of when conducting technical analysis is that “ it does not always work as expected . “
However, believing that it may work as expected, we actually conduct technical analysis and buy and sell, so we should formulate a strategy assuming an unexpected “damage”.
Keep in mind that it is very important for you to make your own investment rules and follow them, such as making a loss cut if you become “bad”.
[/membership_protected_content]