

Our 5th company in the Series of Best Stocks Below Rs. 100 is Manali Petrochemicals Ltd.
This company is good for investing purpose or not ?
Let’s start with the Company profile
Company Profile :
Manali Petrochemicals Limited (MPL) is engaged in the business of manufacture of petrochemicals. The Company is engaged in offering polyols and propylene glycol.
Now Let’s check the important fundamental figures of this company. This is a small cap company with Market Cap ₹1,524cr. We can check more fundamental details below in depth:
Company Fundamental Detail :
PE Ratio: 7.58
Sector PE Ratio: 24.16
PE Ratio of this company is low but better than Sector’s PE. So it’s a Good PE than the peers of this company.
PB Ratio : 3.17
Sector PB Ratio : 3.15
PB Ratio of this company is high than Sector’s PB ratio. So it’s Below Average PB than the peers of this company.
Dividend Yield : 1.69%
Sector Dividend Yield : 1.55%
Dividend Yield of this company is high than Sector. Dividend of this is average than the peers of this company.
ROE: 40.9%
ROCE: 53.7%
ROE (Return on equity) and ROCE (Return on capital equity) is Good
According to above data, this company is looking fundamentally average. Now We’ll check the company Financially data:
Company Financial Detail
| Year | Revenue(cr.) | Profit(cr.) |
| 2021 | 1,037.98 | 201.23 |
| 2020 | 815.91 | 46.66 |
| 2019 | 838.53 | 76.61 |
| 2018 | 750.77 | 57.89 |
You can see the company growth clearly in the above table, in 2019 Net profit was 76.61 Cr. only and in 2020, It decreased to 46.66 Cr. and in 2021, it is increased to 201.23 Cr.
We should check now liabilities of company also in the below table
Total Current & Non Current Liabilities
| 2020 | 2019 | 2018 | 2017 |
| 179.08 | 198.63 | 164.28 | 220.71 |
Liabilities of a company refers to the debt of that company. We should also aware the debt of company. In 2021 , Company have 179.08 Cr. debt.
Let’s check the Free Cash flow of the company
Free Cash flow
| 2020 | 2019 | 2018 | 2017 |
| 58.04 | -5.92 | 26.44 | -35.71 |
Debt Level: Manali Petrochemicals debt to equity ratio (6.8%) is considered satisfactory.
Reducing Debt: Manali Petrochemicals debt to equity ratio has increased from 3.3% to 6.8% over the past 5 years.
Debt Coverage: Manali Petrochemicals debt is well covered by operating cash flow (472.4%).
Interest Coverage: Manali Petrochemicals interest payments on its debt are well covered by EBIT (71.8x coverage).
Share Holding Pattern
| Promotor Holding | Foreign Institution | Mutual Fund | Other Domestic Institutions | Retail & Others | |
| Jun 2021 | 44.86% | 0.87% | 0.03% | 0.02% | 54.21% |
| Mar 2021 | 44.86% | 0.91% | 0.03% | 0.00% | 54.20% |
| Dec 2020 | 44.86% | 0.64% | 0.03% | 0.00% | 54.46% |
| Sep 2020 | 44.86% | 0.0% | 0.11% | 0.01% | 55.02% |
Above table showing there is no big change in Promotors holding which is 44.86% in June 2021. FIIs invested in June 2021 with 0.87% and retail investor is 54.21%.
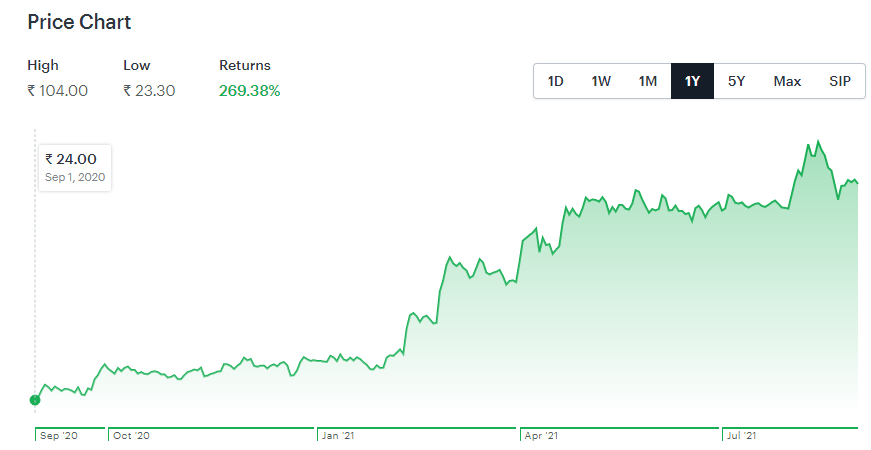
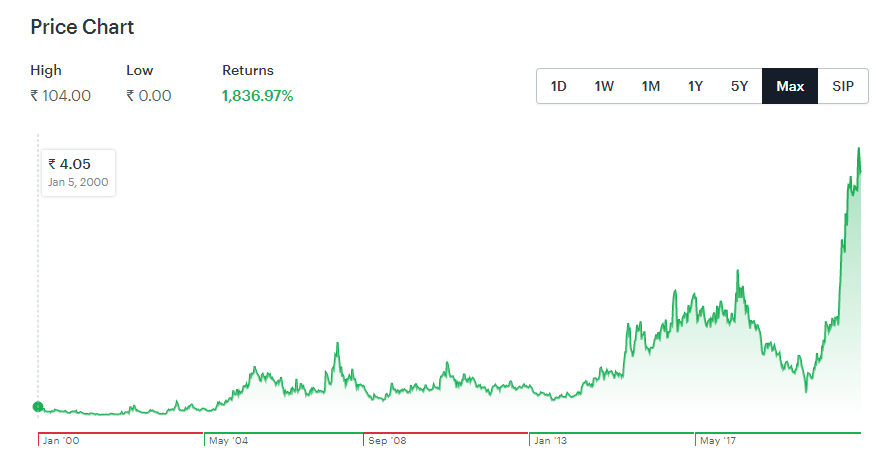
Now We’ll check the return of the company, This company started from Rs. 4.05 at 5 Jan 2000. This company given 269.38% returns in last 1 year from 2020 to 31 Aug 2021.
Investment Checklist for Manali Petrochemicals Ltd.
- The company is currently profitable
- Earnings have grown by 38.8% per year over past 5 years
- Debt level is low and not considered a risk
- Dividend of 1.69% is sustainable
- Share price has been stable over the past 3 months
- The company’s earnings are high quality
- Profit margins improved or Manali Petrochemicals became profitable
- At least 3 years of financial data is available
- No concerning events detected
- Shareholders have not been meaningfully diluted in the past year or recently listed
- Revenue is meaningful (₹13B)
- Market cap is meaningful (₹15B)
- Manali Petrochemicals does not have negative shareholders equity.
According to its historical performance we can predict stock target.
[membership_protected_content user=non-member]
Entry Buying Zone : Premium members can see only
Target: Premium members can see only
Time Horizon:Premium members can see only
Risk Profile: Premium members can see only
[/membership_protected_content]
[membership_protected_content]
Entry Buying Zone : 70 to 75
Target: 110 (50% Upside)
Time Horizon: 1 Year
Risk Profile: High Risk (Stock is 3.71x as volatile as Nifty)
[/membership_protected_content]
Hope you liked Our 5th company in the Series of Best Stocks Below Rs. 100 . We tried to cover many important things about this company, if you think anything left to cover, you can comment us and we’ll try to cover those things also.
Disclaimer: This is an Educational Initiative and is NOT registered under any SEBI regulations. All the information that we provide is just for Educational purposes and you should consult your financial adviser before taking any investment decision. Also we do NOT provide any form of Stock Tips or Advise on stocks or portfolios. My All Trades Only Education Purpose. All trades will be at your risk. You have the responsibility of any trade or any benefit or loss