

The “moving average line” is not only the technical index for trend analysis, but also the most popular one in the whole chart, so if you are new to it, let’s understand it first! Also, if you already know about the “moving average”, why not take this opportunity to review it?
[membership_protected_content user=non-member] Unlock all premium content by purchasing Monthly Subscription plan. You’ll also get Stock buy/sell levels with charts before market open. Checkout our old stocks levels recommendation. If you already have membership please login [/membership_protected_content]
[membership_protected_content]
What is a moving average?
The “moving average line” is the line (line) that calculates the “average value” of the closing price for a certain period in the past and connects the values. For example, “5-day moving average” is the average of the closing prices for the past 5 days including today.
On the next day, we will calculate the average closing price for the last 5 days including that day. Calculate in the same way for the next day and the next day. If the slope of the moving average is upward, it can be judged as “uptrend”, and if it is downward, it can be judged as “downtrend” . It can also be read that if the current price is above the moving average, it indicates an “uptrend”, and if it is below it, it indicates a “downtrend” .
Grab the trend by combining “short-term line”, “medium-term line” and “long-term line”!
The “moving average line” is used by classifying it into short-term lines, medium-term lines, and long-term lines according to the average number of days. The shorter the set period, the closer to the latest price, and conversely, the longer the set period, the longer the price . Taking advantage of this property, it is a method to grasp the trend by dividing it into three major lines, “short-term line”, “medium-term line” and “long-term line” and combining them.
The average number of prices is calculated on a business day basis based on the period of the trend you want to check. For example, when trading from a medium-term perspective, use “daily”, which measures prices by the number of days, for short-term “15 days” for about 3 weeks, medium-term for about 5 weeks “25 days”, and long-term. Set it to “75 days” for about 15 weeks. In addition, when trading from a long-term perspective, use “weekly” to measure the price on a weekly basis, short-term “13 weeks (about 3 months)”, medium-term “26 weeks (about half a year)”, long-term about Make settings such as “52 weeks”, which is one year. In this way, you can change the settings according to each trade.
Analyze the flow of the market with the moving average!
There are several ways to determine the sell and buy signals by combining the price and the moving average, but here we will introduce a major analysis method using the moving average.
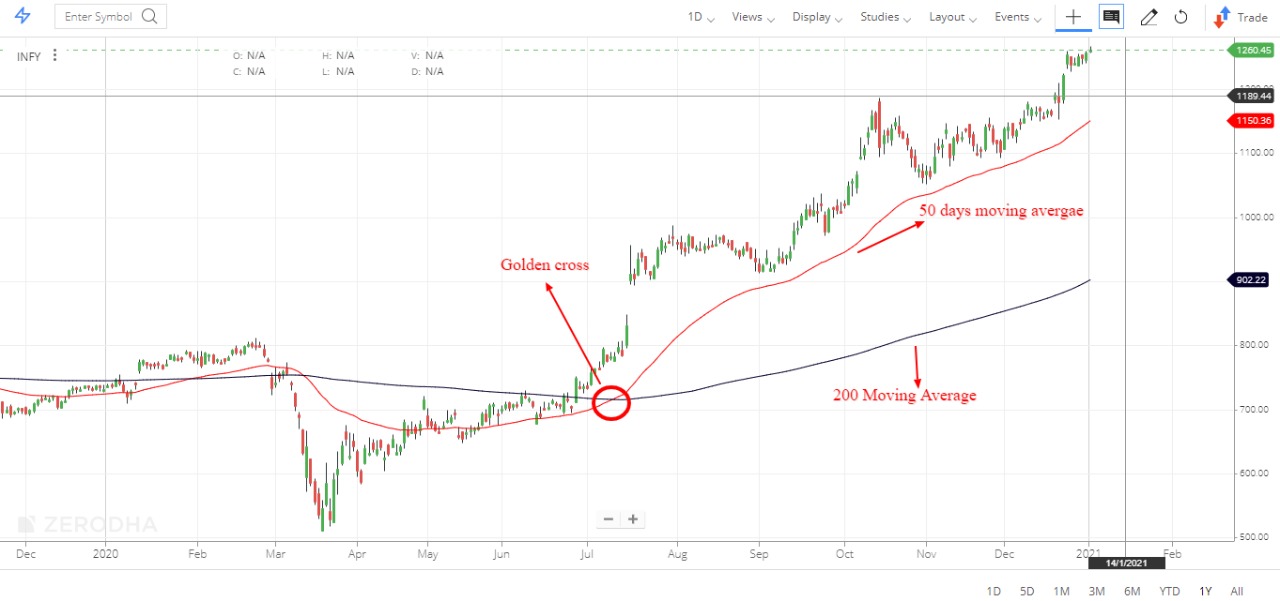
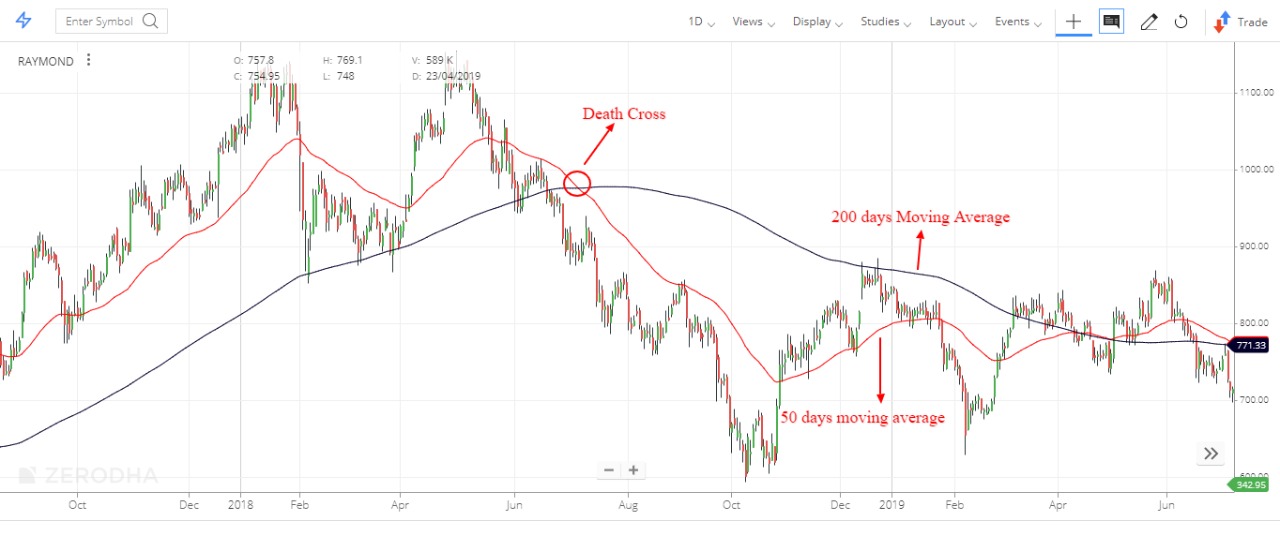
Buy “Golden Cross”, Sell “Dead Cross”
The short-term moving average is on an upward trend, and when it breaks from the bottom to the top of the medium- to long-term moving average, it is the ” golden cross .” Conversely, the short-term moving average is on a downtrend, and when it breaks from the top to the bottom of the medium- to long-term moving average, it becomes a ” dead cross. ”
When a golden cross appears, it means that the normal market price is “bullish”, while when a dead cross appears , it can be judged that the normal market price is “bearish” .
However, you need to be careful about “damage” in the market .
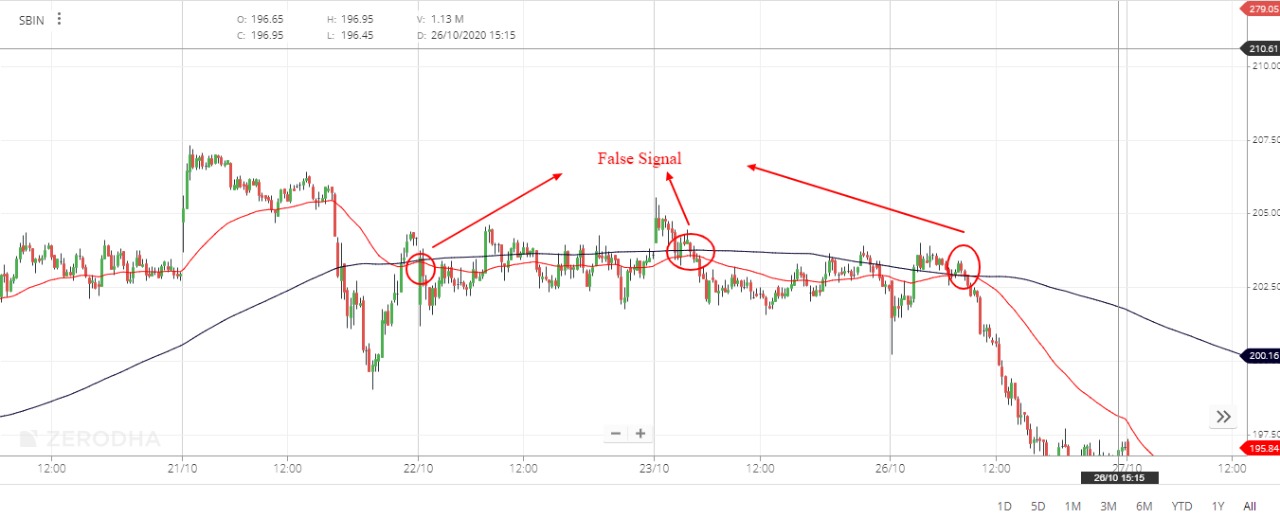
It is said that the moving average line has a big trend, so-called “strong in the big market”, but on the other hand, the one that is famous as a weak point of analysis by golden cross and dead cross is “weak in the conflict market”. Can be mentioned. Since there is no big flow of ups and downs in the “frustration market”, the price keeps drifting near the average value. Since the moving average is calculated by calculating the past average, the buy and sell signs will appear with a slight delay. In the fir market, the time lag causes a “buy sign” to appear even though it is sold, and a “sell sign” to appear even though it is sold, making it easier for the reaction to shift. Such a signal shift is called “damashi”. Care must be taken as it misleads the direction of the market.
Examples of “Golden Cross” , “Dead Cross”, and “False Signal” in the market
The short-term moving average is on an upward trend, and when it breaks from the bottom to the top of the medium- to long-term moving average, it is the “golden cross.”
On the contrary, the short-term moving average is on a downward trend, and when it breaks from the top to the bottom of the medium- to long-term moving average, it is a “dead cross
It is necessary to pay attention to the misunderstanding of the direction of the market, It’s giving False signal also.
[/membership_protected_content]