[membership_protected_content user=non-member]
Unlock all premium content by purchasing Monthly Subscription plan. You’ll also get Stock buy/sell levels with charts before market open. Checkout our old stocks levels recommendation. If you already have membership please login
[/membership_protected_content]
[membership_protected_content]
Here is an ultra simple trading strategy that requires no technical indicators and no technical analysis knowledge. And yet, this strategy is proving to be very effective! This trading strategy is a mixture of non-aggressive scalping and aggressive swing trading .
Note: for more aggressiveness, it suffices to reduce the unit of time and to validate the obliques more quickly; But then we get a lot more false signals …
The principle of this trading strategy:
The trading strategy is to simply draw short-term bullish and bearish slashes, then trade the slant breaks to enter or exit a position . Stops are usually placed above the latest high or low. If the last higher or lower are too far apart, we can bring the stop closer.
The obliques can be drawn on only two contact points (not 3) as long as the highs / lows are well marked.
Here is the strategy applied step by step:
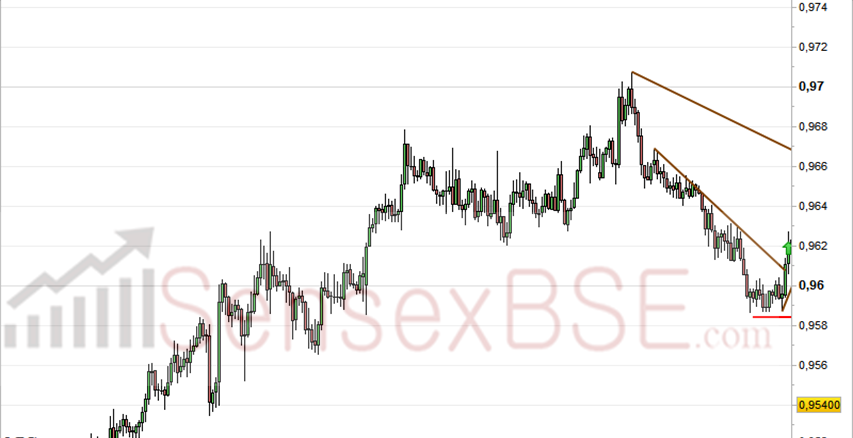
Bearish slant; We enter the purchase with stop loss below the last low

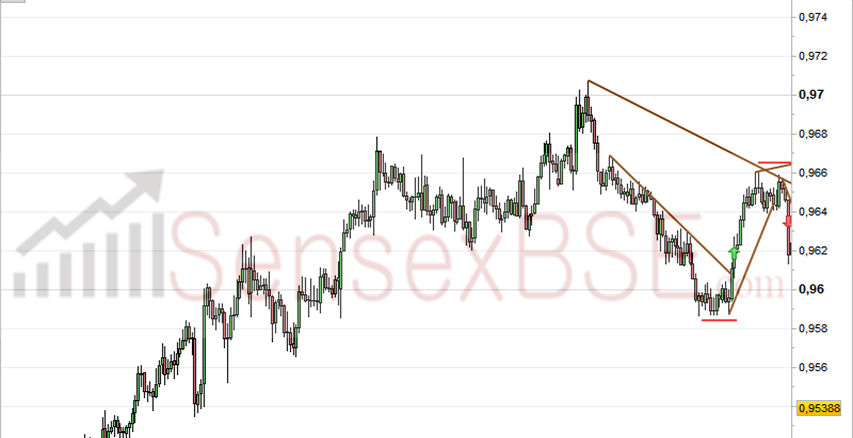
The bullish movement stops around 0.9660. The exit of the Long would normally have been made around 0.9645. Then enter Short at the same price because the price breaks a bullish slant (stop loss above the last highest).

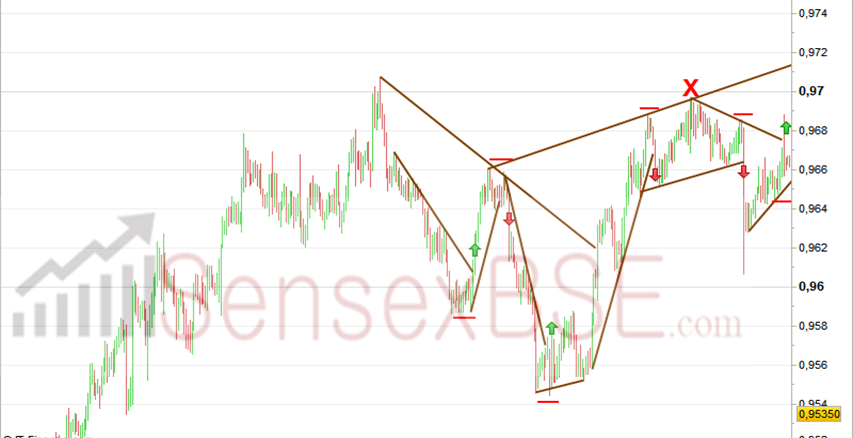
The bearish rally got off to a good start and halfway through the movement, we build a bearish slant which is immediately broken at the end of the movement. This breakout reverses our trade from Short to Long, with stop loss below the latest low (towards 0.9540).

The bullish rally that follows is quite large and builds a new bullish slant. This is broken around 0.9660 to return our trade to short with stop loss above 0.9690.

This bullish slant break did not work. We are normally stopped. We meet flat and we wait .

We discover a little further on two obliques; One bullish, one bearish. We wait for the break; It is ultimately from the bottom; We enter short at the break of the upward slant with stop loss above the last high (towards 0.9690 again …)

Unless you profit at the bottom of the bearish rally, we are still short … But a bullish slant appears and the price rebounds towards the old bearish slant. We finally get a buy signal which returns our trade to Long.
Note: the stop is not closed at the stop loss but with a loss of a few pips; And this even if we moved our Stop above the last high before the breakout of this old bearish slant.
Note 2: on this Long opened in trade reversal, you will notice that we do not place the stop loss under the last “real” low which would be around 0.96. Towards 0.9640 does the trick very well because it would also make it possible to go back short in the event that the new bullish slant already constructed is broken.

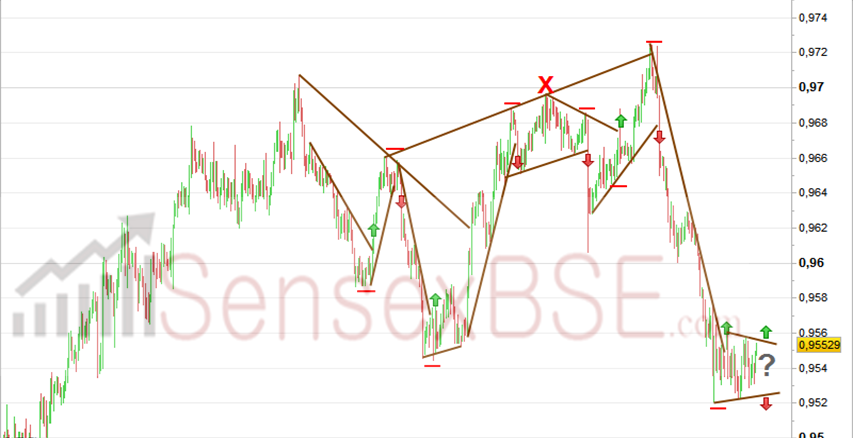
Unless I closed on the touch of the old bullish slant (towards 0.9720) I return the trade to 0.7675 (at the break of the bullish slant on which we are currently working. And we go back short (with stop loss above 0.9720).

Super bearish rally. We come out of the short towards 0.9555 (at the break of the bearish slant having been built in the bearish rally).
We normally entered Long at this same price with a stop loss below 0.9520.
Problem, we currently note the presence of two reverse obliques; Either the exit will be bullish, and the last long open when the last bearish slant (that of the big rally) is broken will return to positive; Either the exit will be bearish and the long will be turned into short (SL of the long executed but entry short at the same price because we have a bullish slant break)

[/membership_protected_content]

