[membership_protected_content user=non-member]
Unlock all premium content by purchasing Monthly Subscription plan. You’ll also get Stock buy/sell levels with charts before market open. Checkout our old stocks levels recommendation. If you already have membership please login
[/membership_protected_content]
[membership_protected_content]
The two previous types of inside bars can be found in an unfinished trend and therefore can be interpreted as continuation signals. But how can you recognize them from the first 2?
There are 2 solutions:
- you learn to recognize the real price movements, therefore the real price action, often different between one underlying and another and moreover that it is not viewable on the images;
- you don’t betray them.
 How the price moves and operational ideas
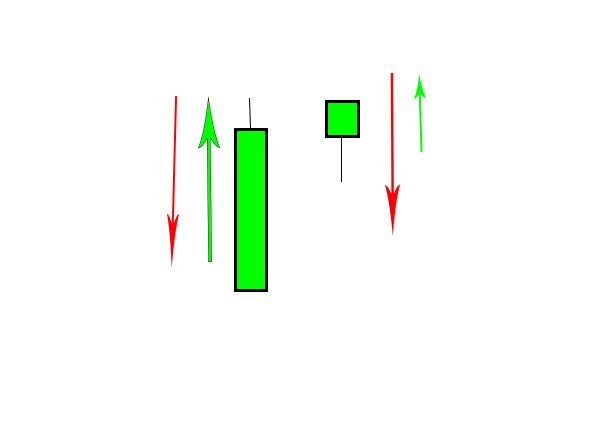
We are on a relative minimum, how can we understand if it is the previous case (figure 7) or a continuation of a downward trend?
In the case of a relative low , often the shadows of the outside can make the difference, but what can make it the most is the real movement of the price. In the latter case, it first breaks the high or the closing of the inside bar and then goes down, then you go short at the break of the low of the same or at the break of the close of the same.
In the event of a relative maximum to be broken during an uptrend instead, the price will first linger on the opening of the inside bar and then take its upward direction. In this case you always enter long at the break of the maximum of the inside or at the close.
Stop loss and take profit always as before and based on your personal trading.
[/membership_protected_content]

