[membership_protected_content user=non-member]
Unlock all premium content by purchasing Monthly Subscription plan. You’ll also get Stock buy/sell levels with charts before market open. Checkout our old stocks levels recommendation. If you already have membership please login
[/membership_protected_content]
[membership_protected_content]
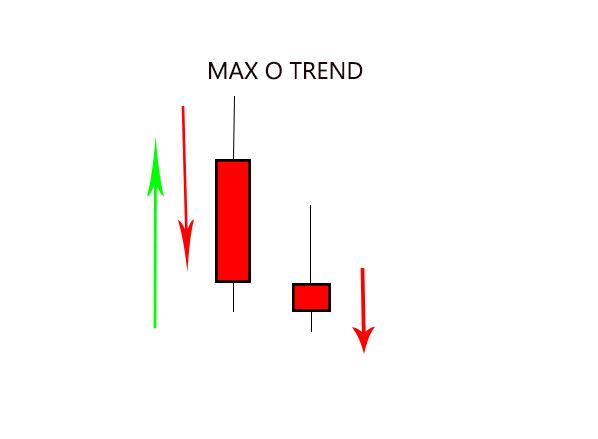
The bearish inside 16 is very similar to that of figure 15. In this case, however, it has a much more pronounced upper shadow and sometimes also has a small lower shadow, in the same way as the outside.
What does it all mean?
That the price movement is much more nervous. For what reason? Because we are in the presence of a probable further drop in the price and you know, when the price falls, it does so much faster than when it rises .
How does the price move?
- downward trend with the possibility of continuation or upward movement with the achievement of a relative maximum and probable inversion ;
- the outside candle is bearish and often with a larger upper shadow and a smaller lower shadow. This is because the price first rises and then falls quickly, sometimes showing indecision even on the minimum which then goes to contain the next inside;
- the price opens and rises nervously towards the opening of the outside candle and returns to fall just as nervously, closing at the limit of its own opening but a little lower, sometimes showing a small shadow on the minimum, a sign of further indecision ( inside bar );
- the price rises beyond the opening of the inside and sometimes close to the maximum or above, and then goes down very quickly.

Operational idea
- you enter short when the price exceeds the minimum of the inside bar or its closing;
- stop loss on closing of the inside, on the maximum or on the maximum of the bar in formation;
- take profit as before.
[/membership_protected_content]

