[membership_protected_content user=non-member]
Unlock all premium content by purchasing Monthly Subscription plan. You’ll also get Stock buy/sell levels with charts before market open. Checkout our old stocks levels recommendation. If you already have membership please login
[/membership_protected_content]
[membership_protected_content]
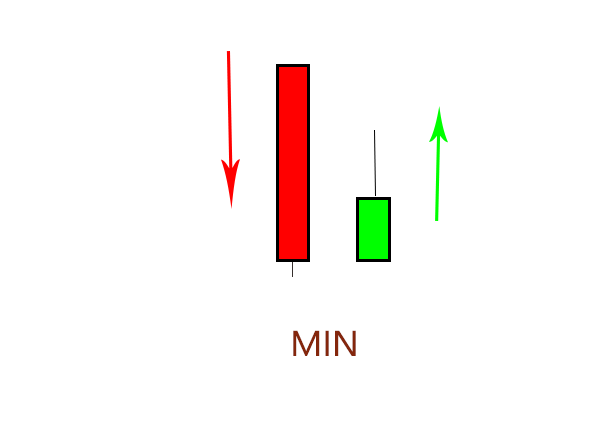
What is the difference between figure 2 and figure 3? We are always in the presence of a relative minimum after a downtrend, but the red bar outside this time tells less “indecisions”. Also, the inside bar is at the limit of the minimum , because the outside bar does not have an accentuated shadow like the one in the previous figure. What happens in this case? The price goes up much faster and more decisively.
 Operational idea:
- you go long when the price exceeds the closing or the maximum of the inside candle, it always depends on the time and risk;
- the stop loss must be placed below the relative minimum, below the minimum of the inside candle or below the minimum of the candle in formation;
- take profit as before.
[/membership_protected_content]

