[membership_protected_content user=non-member]
Unlock all premium content by purchasing Monthly Subscription plan. You’ll also get Stock buy/sell levels with charts before market open. Checkout our old stocks levels recommendation. If you already have membership please login
[/membership_protected_content]
[membership_protected_content]
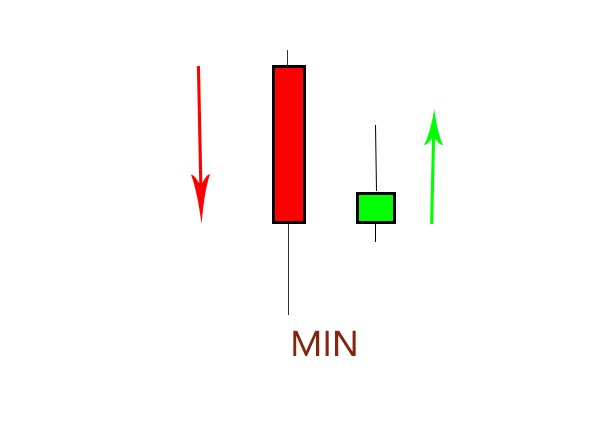
The second bullish inside bar is opposite to the previous one, because it is on a relative low, i.e. a low of at least 20 bars.
Here’s how the price moves in that case:
- bearish trend or bearish breakout;
- formation of a bearish bar, whose relative minimum is the minimum of at least 20 bars;
- the price is quite nervous and indecisive, it can be seen from the shadows of the red candle, with a lower shadow (or shadow) much more pronounced than the upper one;
- this time the inside bar stops the movement speed a little, it is therefore smaller than the inside 1, its bullish body leans on the close of the outside bar and the maximum is below the opening of the red bar;
- the price at this point can move in different ways, but often it will first touch the opening of the inside bar or it will go to violate the minimum and sometimes even the minimum of the outside bar, and then quickly rise. Other times, however, after a slight indecision, it will go up directly.

The operational idea is:
- if the price falls to the minimum or beyond, wait for the re-entry into the body of the inside candle to go up , or to break its maximum;
- if the price rises directly, you can go up when the maximum of the inside candle is broken;
- the stop loss must be entered on the minimum of the inside candle or on the minimum of the candle in formation after the entry;
- take profit as a previous example.
[/membership_protected_content]

