“Parabolic” means “parabola” and refers to the parabolic-shaped lines that appear above and below the candlestick chart. Like the “RSI”, it was developed by US chart researcher W. Wilder and is a technical index that “plays an active part in the big market (when forming a big trend)”.
What is Parabolic?
Parabolic is a line made up of SAR (Stop and Reverse) values.
Normally, when the candlestick is above the parabolic, it indicates the “up market”, and when it is below it, it indicates the “down market”. If the candlestick breaks below the parabolic in the rising market, it is called a “sell sign”, and if the candlestick breaks out of the parabolic in the falling market, it is called a “buy sign”.
Parabolic formula
Same day SAR = previous day SAR + acceleration factor x (new value-previous day SAR)
| New value: | In the case of an up market, it refers to the new high price of the trend, and in the case of a down market, it refers to the new low price of the trend. |
| Acceleration factor: | Acceleration rate for each new value update, increase from initial value (From JW Wilder’s rule of thumb, 0.02 is appropriate for initial value and acceleration factor) |
| Maximum acceleration rate: | Upper limit of acceleration factor (0.2 is considered appropriate) For example, if the maximum value is 0.2, the initial value is 0.02, and the acceleration factor is 0.02, it will be added when the new value is updated up to 9 times. |
How to measure trading timing using parabolic
How to measure trading timing
When the “stock price” is above the “parabola (parabola connecting the SAR)”
⇒ We think that the price is on an upward trend or an upward trend.
When the “stock price” is below the “parabola (parabola connecting the SAR)”
⇒ We think that the price is on a downtrend or on a downtrend.
[Buy signal]
When the candlestick penetrates the parabolic from bottom to top in the downtrend
[Sell signal]
When the candlestick penetrates the parabolic from top to bottom in the uptrend
Parabolic chart example
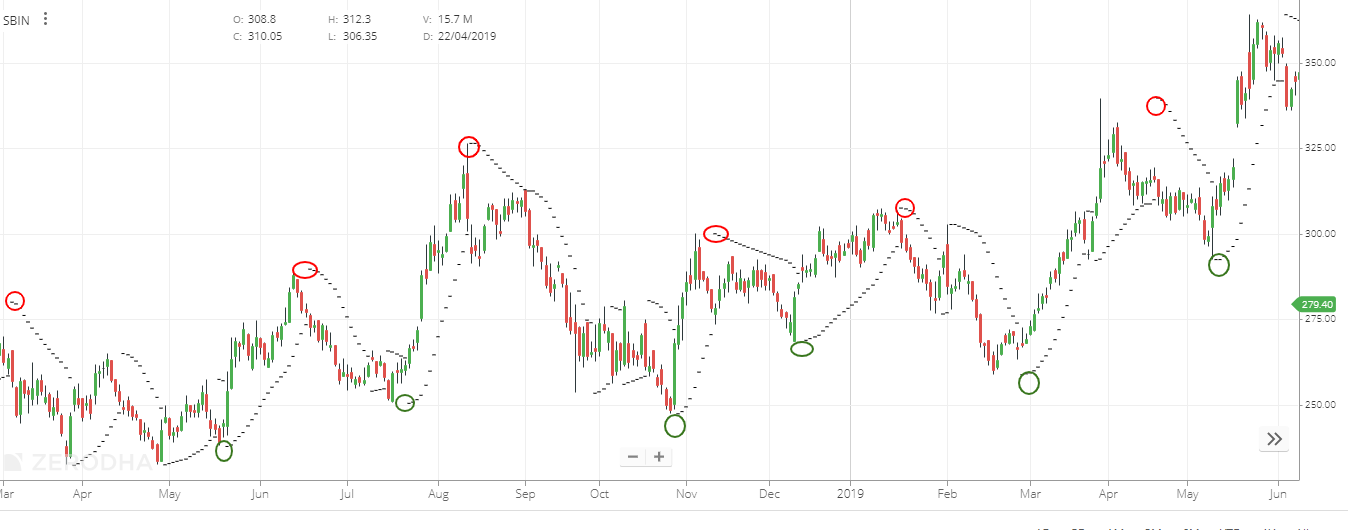
If you look at the chart below, you can see that the part circled in green is the part where the candlestick penetrates the parabolic from the bottom to the top in the downtrend.
This is the “buy signal”. On the contrary, the part circled in green can be seen as the part where the candlestick penetrates the parabolic from top to bottom in the uptrend. Such a state indicates a “sell signal”.
As a method of measuring the timing of buying and selling using market speed, take a “buy” position when the dot of SAR-Low is attached, buy and sell in the opposite direction when the dot of SAR-High is attached, and set the “sell” position The method of taking is conceivable.

In “parabolic”, when the fluctuation of the stock price is small, the trading signal may be delayed or the trading signal may appear frequently. In the case of small price movements such as the box market, it is unlikely that the stock price will move according to the parabolic street, so avoid making judgments by looking at this index alone as much as possible, and use it well with other indicators to yourself. It is necessary to find a proper trading timing . Also, keep in mind that it is very important for you to make your own investment rules such as loss cuts and follow them in case of “bad” investment.

