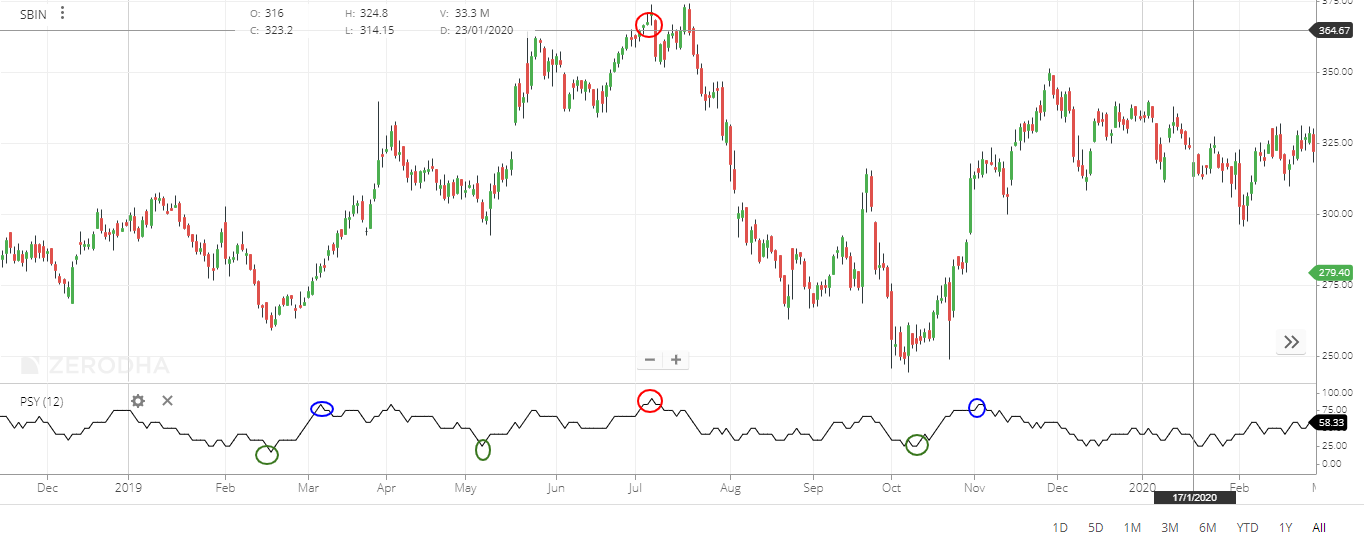
The “psychological line” is an index based on the premise that “price movements can reflect the psychology of investors.” Although the calculation method is simple and easy to understand, there are many “damages”, so it is desirable to use it in combination with other indicators.
[membership_protected_content user=non-member] Please buy Monthly Subscription plan for Stock buy/sell levels with charts before market open. Checkout our old stocks levels recommendation. If you already have membership please login [/membership_protected_content]
[membership_protected_content]
What is a psychological line?
“Psychological” means “psychological”. As the name implies, “Psychological Line” is a technical analysis method that quantifies the psychology of investors and determines the timing of buying and selling . If the price continues to fall for a long time, the number of investors who think that “it may be about to start rising” and “this may be the time to buy” tends to increase. Or, as prices continue to rise, more and more investors are thinking, “I think it’s about time to stop rising and start falling.”
The “psychological line” utilizes this kind of investor sentiment.
How to measure trading timing using the psychological line
How to measure trading timing
The “psychological line” is a percentage of the number of days in which the closing price of the current day is higher than the closing price of the previous business day, usually in 12 days. If that number is below 25%, it is considered to be at the level of “oversold and is about to rise”. On the other hand, if it exceeds 75%, it is analyzed as “overbought and it is about to fall”.
Psychological line chart example
The calculation method of “psychological line” in the initial setting of market speed is as follows.
(The number of positive days compared to the closing price out of 12 days) ÷ 12 × 100 (%) Since
it is calculated by the above calculation method, the price range etc. is not used in the calculation and it is the number of days that increased within the calculation period Only shows. For example, if all 12 days were positive relative to the closing price, the psychological line would be 100%.
If you look at the chart below, the green circles are the parts that are 25% or less. In the above formula, 25% means that there were days when it rose 3 days out of 12 days and days when it fell 9 days. In other words, the psychology of investors is at the level of being aware of “oversold.” On the contrary, the red circle is the part that is 75% or more. 75% means that there were 9 days up in 12 days and 3 days down, so I think we are at the level of being aware of “overbought.”

If it is below 25%, it is considered to be at the level of “oversold and is about to rise”, and if it is above 75%, it is considered to be at the level of “overbought and is about to fall”. Analyze
However, since there are many examples of “psychological line” being “damaged” like blue square in the chart, avoid making judgments by looking at this index alone as much as possible, and find your own trading timing by using it in combination with other indicators. Is necessary .
Also, keep in mind that it is very important to create your own investment rules such as loss cuts and follow them in order to make an investment.
[/membership_protected_content]

