When to buy stocks? What is the specific time?
I’ll show you when to buy stocks ! If you haven’t decided what brand you want, you should decide the brand first in the following article! The following two are recommended when buying stocks.
2 Recommended Stocks When Buying
- Buy a bargain.
- When the stock price is temporarily falling due to bad rumors.
Let’s take a closer look at each.
The most recommended time to buy stocks is to buy a bargain
What do you mean by buying a bargain?
The bargain buy is when the stock price, which is on the uptrend, temporarily drops.
I’ll explain using an actual chart. It’s easy to understand if you compare it with the chart of the brand you want!
Stock prices fluctuate up and down repeatedly to form trends. Bargain buying is buying when the stock price, which is on the uptrend, temporarily falls.
First, I would like to introduce the uptrend. An uptrend means that stock prices are on an uptrend over the long term, as shown in the figure below.
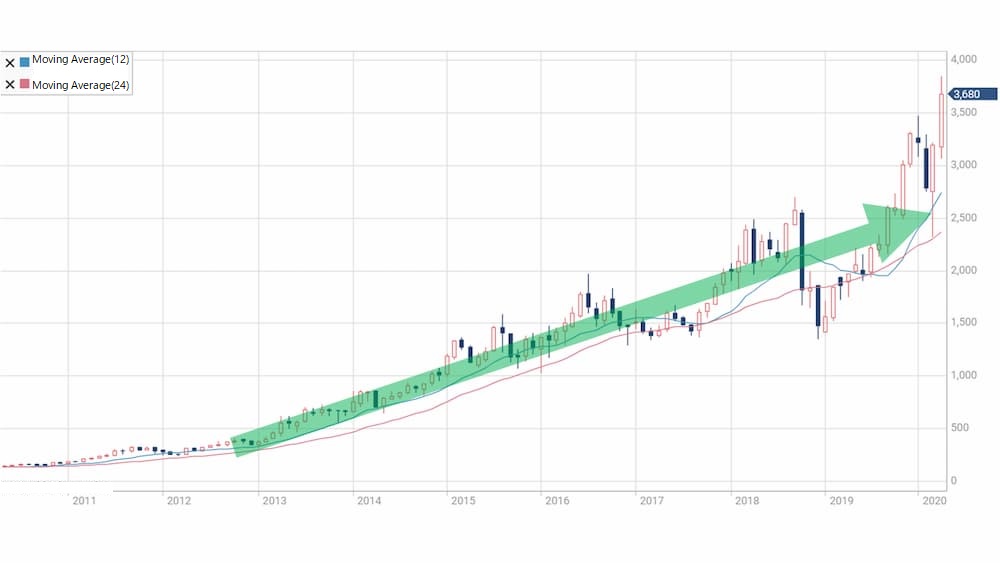
As shown by the green line, stock prices are gradually rising. This is called an uptrend.
So when is the “push” on this chart? Since it is the timing when the stock price temporarily dropped, the red circle in the image below corresponds to the “push”.
I see! I knew what the timing of the “push” was. But how do you find the “push” …?
Use the 25-day moving average!
What is the 25-day moving average?
The 25-day moving average is the line connecting the average stock prices for the 25 days including that day.
Stock prices tend to return to the 25-day MA once they move away from the 25-day MA. Let’s take a look at the actual chart.
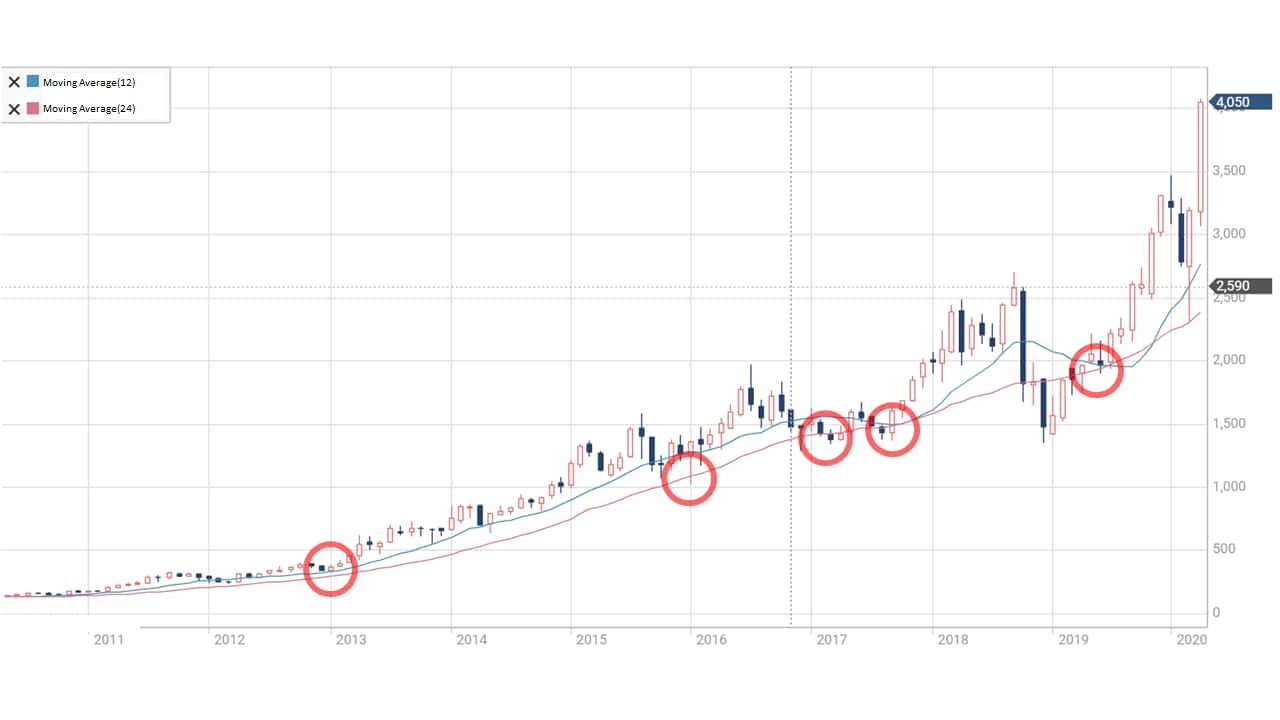
The red line in the image above is called the 25-day moving average. Stock prices are rising along this moving average. Therefore, the red circle is a squeeze and it is a good buy.
However, you can see that the timing of the red circles is different on the two charts. Keep in mind that you can’t hit 100% of the squeeze like this.
Of course, it is difficult to get used to it, but by gaining experience many times, you will be able to find and buy in this way.
Why is there a timing of a squeeze (stock price goes down) during an uptrend?
The reason for this is thought to be the sale by investors who want to “fix their profits” when the stock price rises.
② When the stock price is temporarily falling due to bad rumors
The more people want a stock, the higher the stock price, and conversely, the fewer people want it, the lower the stock price.
As a result, scandals and rootless and leafless hoaxes can cause stock prices to fall below their original price. The timing when the stock price is falling due to hoax is quite the time to buy.
The reason is that the stock price is temporarily lowered due to the hoax, and eventually it will return to the stock price that the stock should have.
Here, the content such as “Tesla goes bankrupt.” Is written. This lie caused the stock price to fall temporarily. However, professional investors bought Tesla shares without being fooled by false tweets.
So what’s the difference between a regular investor and a professional investor?
Due to this tweet, many general investors placed sell orders with the feeling that they had to sell before going bankrupt! Professional investors found the tweet to be a lie because Tesla’s operations remained in the black.
In fact, Tesla’s share price has since risen sharply, and its maximum share price has tripled.
In other words, if you don’t get confused by false information, you can buy stocks at a very good time.
Extra: Does it matter when you buy stocks ? !!
For those who are extremely eco-friendly, we would like to introduce the “dollar cost averaging method”!
You don’t have to worry about when to buy it . The dollar cost averaging method is a method of investing the same amount every month .
Let’s talk about why the dollar cost averaging method is good. Using the dollar cost averaging method, you spend only the same amount each month.
Therefore, if the stock price is high, you can buy only a few stocks, and conversely, if the stock price is low, you can buy many stocks.
By continuing this, you will buy more stock when it is relatively cheap. As a result, the amount of money spent on one share held will be reduced.
Let’s consider a concrete example.
Dollar = cost averaging
Let’s consider the case of spending Rs. 10,000 every month for investment.
| 1st month | 2nd month | 3rd month | 4th month | 5th month | |
| Stock price | 2,000 | 2,500 | 1,000 | 5,000 | 1,250 |
| Number of shares purchased | 5 shares | 4 shares | 10 shares | 2 shares | 8 shares |
| Cumulative number of shares held | 5 shares | 9 shares | 19 shares | 21 shares | 29 shares |
| Amount per share | 2,000 | 2,222 | 1,579 | 1,905 | 1,724 |
By buying more stock when the stock price is high and buying more stock when the stock price is low, the average stock price per share is about Rs. 1,724.
You can buy it much cheaper than buying a lot in the first month!
In this case, all you have to do is decide how much you will spend on your investment each month.
It’s very easy because you can start with the funds that suit you!
Timing to never buy stocks
So far we’ve looked at when to buy stocks, but now let’s look at when you should never buy stocks.
When to not buy stock
- Immediately before the dividends date
- To obtain “shareholder benefits” or “dividends,” you must hold shares on a date called the vesting date.
- As a result of a flood of people trying to buy shares for shareholder benefits and dividends before the vesting date, the stock price will rise slightly.
The basis of stocks is to buy cheaply and sell high, so avoid it before the vesting date.
Two things to do after buy stocks
So far you’ve learned about buying stocks. So what do you do after you buy the stock?
What to do after buying stock
- Set the loss cut line
- Determine when to sell
Let’s take a closer look at each.
Set the loss cut line
Loss cuts are important in preparation for a fall in stock prices. In order to perform loss cut, it is necessary to set the “loss cut line” in advance.
What is a loss cut line?
The loss cut line is the stock price that is set to minimize the loss when the stock price goes down. If it falls below that price, it will decide to sell the stock.
When a loss occurs, many investors keep holding it, thinking that it will recover someday. However, the risk that the stock price will continue to fall and cause a big loss will increase considerably.
Loss cut lines are needed to minimize such losses.
But where should the loss cut line be set?
As a guide, it should be about 10% lower than the stock price when you bought it!
It is common for beginners to see stock prices continue to fall and unrealized losses swell while they expect to recover.
It is necessary to have the courage to hold back and make a selling decision here. Let’s take a look with a concrete example.
Determine the loss cut line
When you buy a stock for Rs. 950 per share, the loss cut line is where the stock price has dropped by 10%, so 950
x (100% -10%) = 855 .
If you fall below the loss cut line, it is important to make a decision to sell the stock.
Determine when to sell
If you can buy stocks cheaply, you aim to sell them high next time, right? The timing of selling is as important as the timing of buying.
No matter how cheap you can buy it, if you miss the timing to sell it, everything will be a bubble of water.
Bonus: You can see when to buy stocks in the form of a chart! ??
As with the bargain purchase introduced at the beginning, there is a method called ” technical analysis ” that determines when to buy a stock from a specific movement or shape of the chart .
This time, we will introduce the Japanese chart patterns called “ buying time “ from the famous “Sakata Goho”.
By the way, the content introduced here is a little difficult, so I will start stocking from now on! If you are a beginner in investment, you can skip it at all .
If you would like to know more about technical analysis, please see the following articles.
Let’s start with Sakata Goho.
Sakata Goho
Sakata Goho predicts the movement of the next chart from the arrangement of candlesticks.
Sakata Goho has five basic chart patterns . This time, we will introduce the chart pattern of the buy signal from among them.
A buy signal is like a sign that the chart is likely to go up when it looks like this!
Mikawa
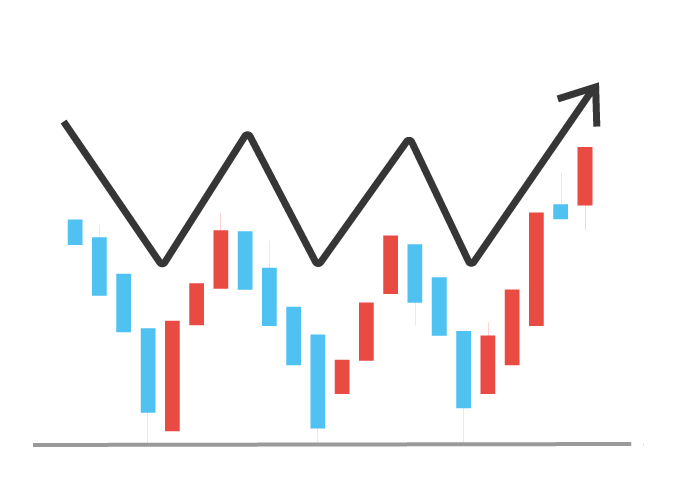
The chart pattern that creates three valleys in the bottom price range (when the stock price is low ) is called Sansen. After the chart takes this shape, it is highly possible that the stock price will start to rise significantly, and it is said to be a ” buy sign “.
Head and shoulders shoulders
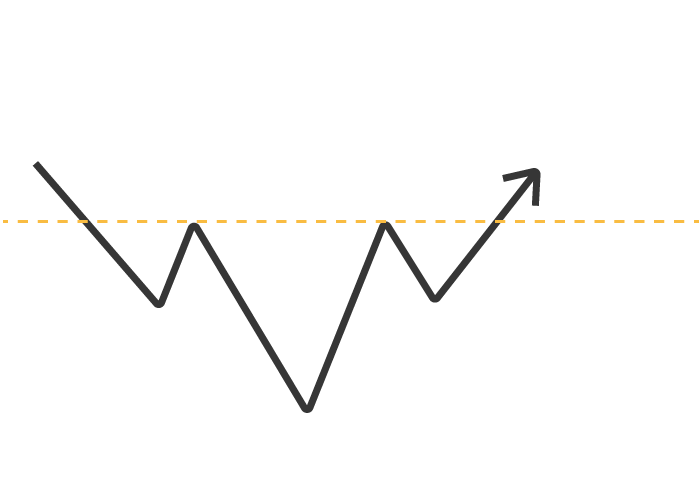
As with Mikawa, the head and shoulders shoulders think that the bottom of the market that could not be passed three times cannot be broken through, and that this is the bottom of the market and is a “buy sign”.
Unlike Mikawa, the highest point in the middle of the three mountains is the main feature of the head and shoulders shoulders .
Sanku
Mitsuzora is a method of contrarian when windows appear three times in a row on the chart .
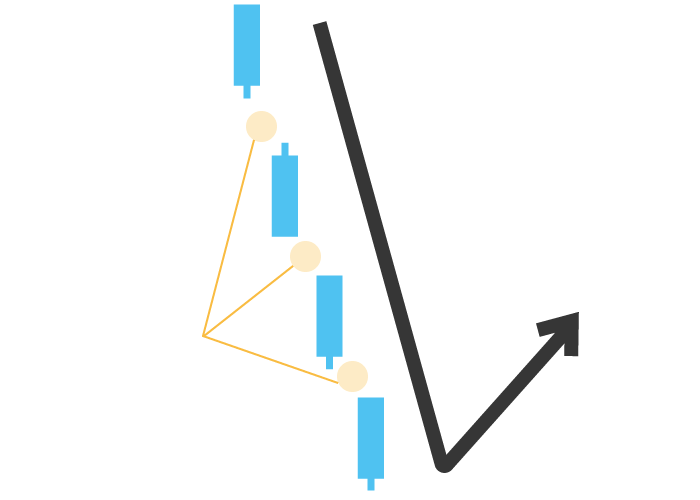
A window is the gap between charts . For example, if the closing price on the previous day was 100, but the company announced an upward revision of its business performance while the exchange was closed, many people would like to buy the stock of the company, and the next day. The opening price may be 120, which may be significantly different from the previous day’s stock price.
Between the previous day and the next day, between 100 and 120, no transaction will be completed and a window will be formed.
As explained earlier, opening a window means that there is more intense trading material in the market . On the other hand, overheated stock prices move back to their original normal stock prices .
It is the three-sky slamming that takes advantage of this property .
When the market price is falling overall, if there are three consecutive windows on the chart, it is a buy signal .
On the other hand, in some cases, it may continue to fall and form a downtrend, so be careful.
Sanpei

The appearance of three positive and negative lines in a row is called “three soldiers”.
And, the appearance of three positive lines in a staircase pattern is called ” Red Three Soldiers “.
Basically, the positive line is often expressed in red, so it is called this way.
In this way, the red three soldiers, whose positive lines indicating the rise in stock prices appear three times in a row, are considered to be “buy signals” in the pattern of entering the rising market as they are.
As a caveat , if the Red Three Soldiers appear in the lows, you can think of it as a pure buy signal , but if they appear in the highs, that is the end of the rise, or in the three skies. On the contrary, it is possible that the price will rise too much and will fall in the future, so be careful.
Sanpo
The Sanpo is a chart in which after the first Taiyo line appears, a small positive line or a hidden line is sandwiched between the squeezes and consolidators, and then the next Taiyo line appears.
This is a form that often appears when the market is on an uptrend .
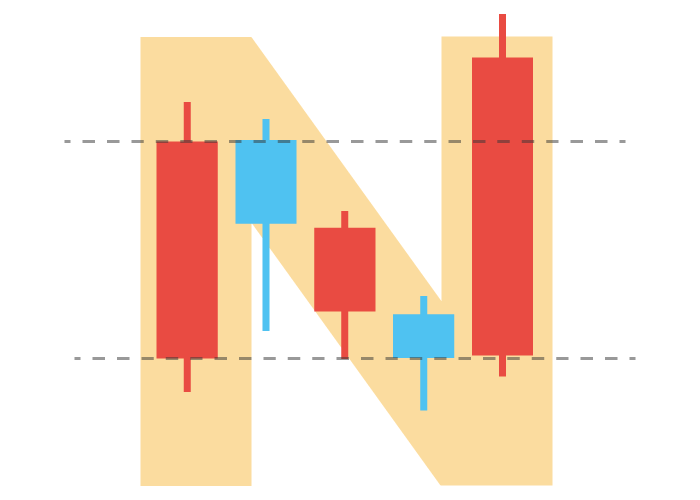
When the next Taiyo line updates the high price of the previous Taiyo line, we judge that the market price will rise through the squeeze and buy.
When the stock price moves, it does not simply rise in a straight line, but it has the characteristic of drawing a jagged chart by repeating rising and falling a little like the three methods.
There are investors who want to make a profit when the stock price goes up and investors who sell in anticipation of going down, so it moves in a jagged manner.
Summary
“What is the best time to buy stock?” It is very difficult to answer this question.
However, by using these methods used by many investors, it is possible to increase the probability of finding the best time to buy.
It is also very important to learn about when to sell stocks and when to sell stocks after buying more than when buying stocks.
This time’s point
- When buying stocks, let’s make a decision by buying a bargain
- Don’t forget to put in the loss cut line

