I have not written for a while, it causes important changes in my private life, but I want to resume sharing what is my personal trading and the evolution of my studies, always aimed at following the truth expressed by the price on the graph and that on the financial speculation in general.
Truth is an ambiguous term that is often confused with foresight in trading, probably also due to those trading gurus who abuse it.
No one can know reality before it happens: no trading strategy can show you the truth in advance, but it can only show you the way to follow it.
Following the truth, for a successful trader
means following what is happening on a trading chart, applying a probabilistic and personal study for market entries and exits, canceling one’s own and others’ opinions. All this is summarized in the trader aforementioned trading plan , which then only a few really know how to program.
In short, if you have decided to make 2 trades a day, following such a strategy and lose a maximum of 2000 Rs to eventually earn triple, you must follow what you planned to the letter, otherwise it will be a big disaster in the long run.
It seems a stupid thing, enunciated by anyone, but unfortunately planning is boring, just as it is tired to always use the same strategy and therefore these are tips that are never followed, with consequent negative results.
You no longer follow the truth, but passion and play. Because trading has to be fun and not boring.
On the other hand, following the truth is essential to be able to do well in this risky job. trading is not a game at all and it is normal for it to become tedious, don’t be afraid of it.
The truth is never compelling, but in the long run it wins.
How to apply the truth on a trading chart?.
There is nothing different in what I have been doing for a long time, other than sharpening awareness of the truth and following it.
In this operation I used the trading techniques that I have been using for some time now:
- closing of the previous day ;
- signal to follow a trend ;
- resistance and support levels as I understand them;
- strong hands decision bar .

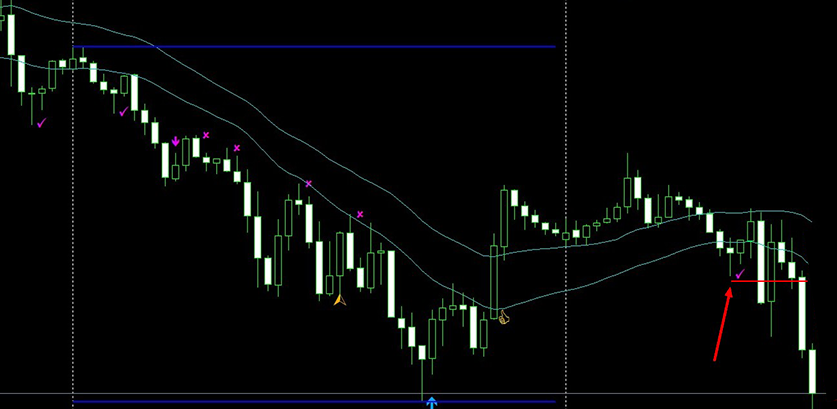
The indicator shows nothing but 3 consecutive minimums and 3 decreasing maximums in a given situation and with other small trader tricks.
The signal showed up on the TF at 30 minutes. For entry I waited for a time more suited to my trading and a second crossing as confirmation.
I therefore narrowed the field for entry by switching the time frame to 5 minutes.

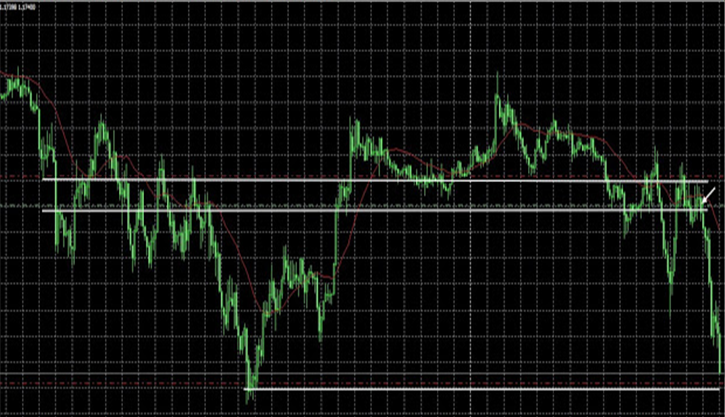
We are in the price range of the previous day.
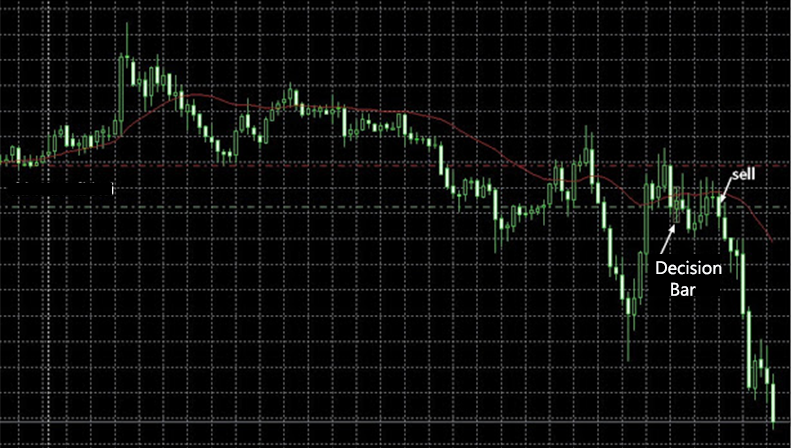
A strong hand decision bar emerged at a time when they are present, leaning against the close of the day before and other levels of possible trader resistance.

The decision bar is broken up and down. The price then rises again slightly above its maximum and a doji forms right in correspondence with it. I therefore go down on the next bar after the price rises and falls, breaking down the open / close of the doji.
My stop loss is a few points, on the high of the doji, while the take profit , fixed, about 6 times larger, on yesterday’s low.
The take profit is reached, but the price falls a bit more, breaking the low and then bouncing.
By learning about the right price levels , you can figure out where to enter but also where to take any profit. I usually advance it a bit, so as not to have bouncing problems right at the edge of my TP, so I don’t risk it not being caught.
The things I do are always the same and, just by continuing to do them every day, I am able to see them better and better and improve my trading, minimizing my risk.
Seeing and following the truth is simple and under the eyes of anyone, so you can safely see it and follow it too if you have patience and discipline.
I’ll come back to this, but I want to show you more about my studies soon. In the meantime, I hope that this idea will be useful for you to better follow the truth of your trading.

